Solar Calculations Math Tutorial for Solar Energy Power Systems
Electricity can be a mystery to folks who have never had any experience working with it, or for folks who took physics in high school and can't remember much of anything other than that the battery made the light bulb glow.
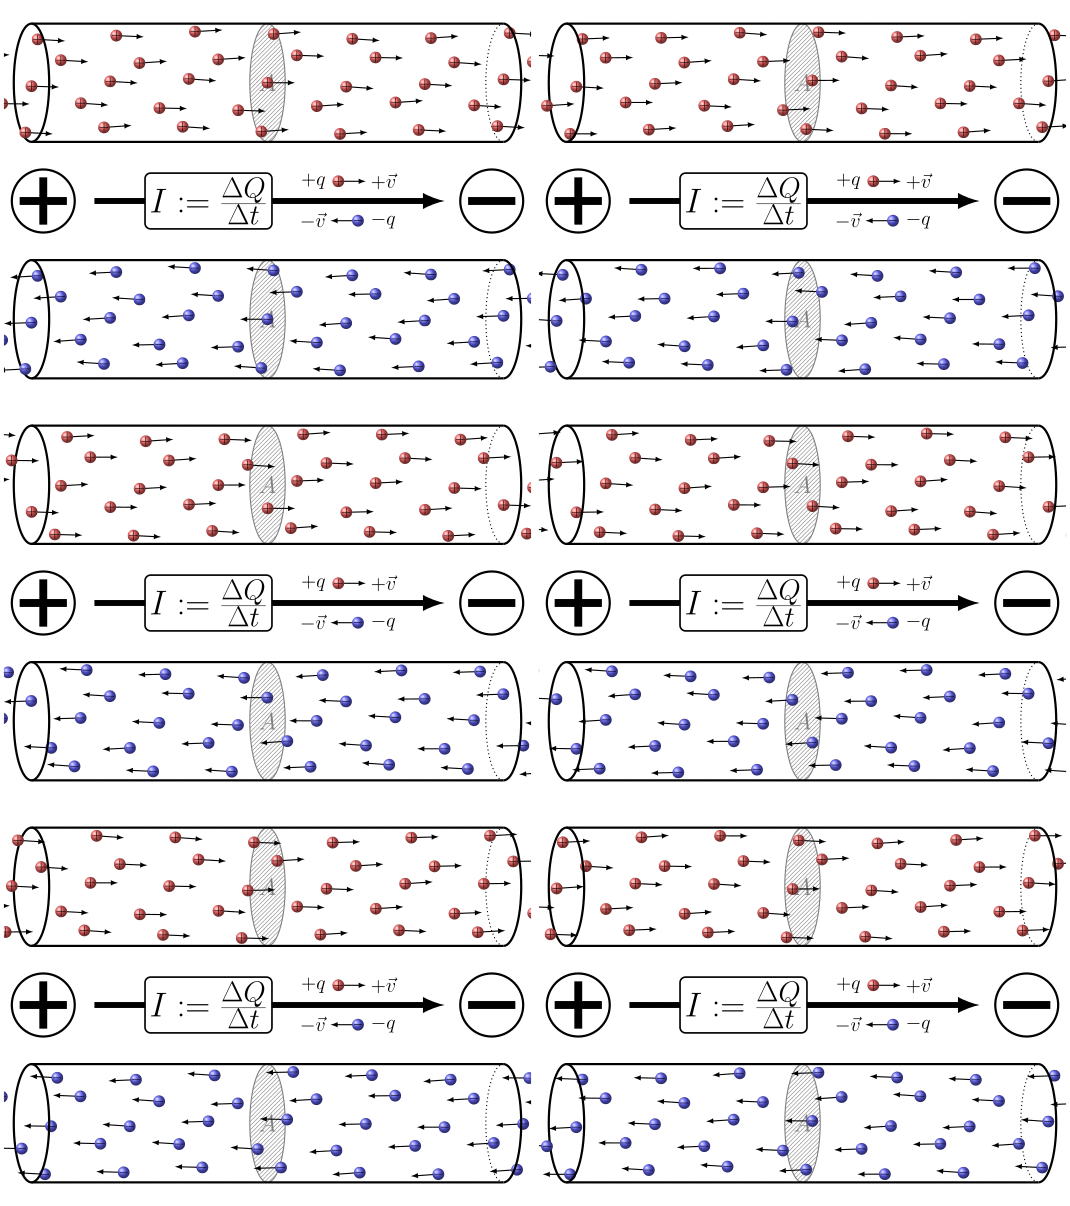
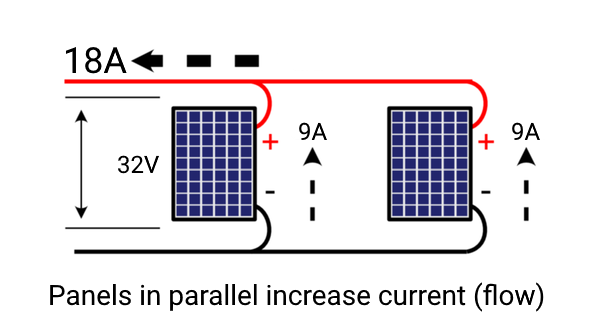
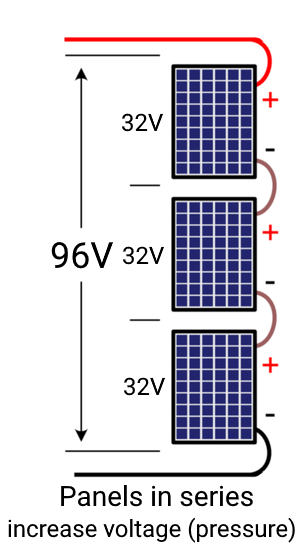
Basic electric calculations for off grid solar applications are not that hard, but you have to know the terminology. Here it is. Don't quit now, it's really pretty easy, but you have to learn the vocabulary for it to make sense. Electricity can be visualized very easily using a water analogy, or in some cases, horsepower, gas tank size and miles per gallon might be a better way to conceptualize electricity.
Advanced Terms and Concepts
Solar Calculations Math
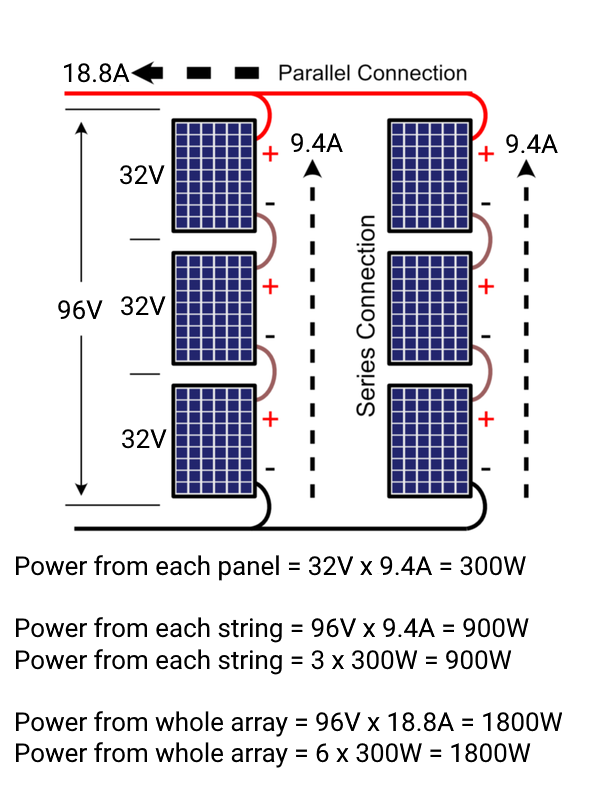
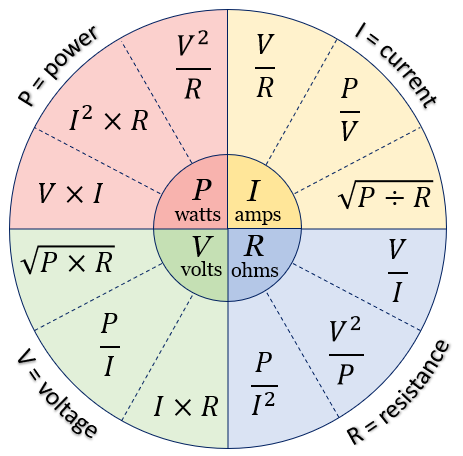
All of these electrical units of measure are used together to determine the Volts, Amps, Watts and Watt-hours for any particular solar electric application.
There are a lot of other nuances to consider when sizing equipment for a specific application. The trade off include cost vs. desired outcome, available rooftop or battery storage physical limitations, wire sizing and electrical efficiencies, seasonal or climate tendencies that may affect solar power generation, or even product availability.
Getting the most out of your panel
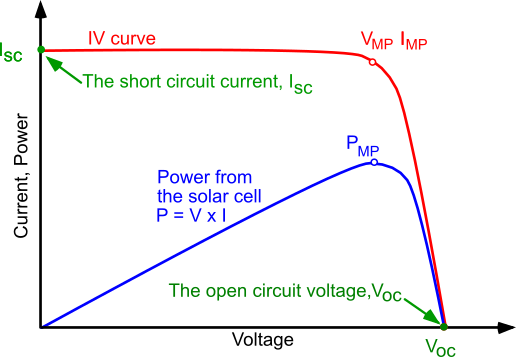
The IV (pronounced eye-vee, as in the symbols of units of measurement for current and voltage) curve of a panel describes the practical current output at a given voltage. Ideally, a power source would be able to supply infinite current at any given voltage, but practical power supplies, including solar panels, have limits.
For solar panels, the IV curve is used to determine at which current and voltage level the most power is produced by the panel. Since power is determined by the voltage times the current, the maximum power would be the area under the IV curve that has the maximum area. The blue line represents the area of that curve and the top of the blue line would be the greatest power production.
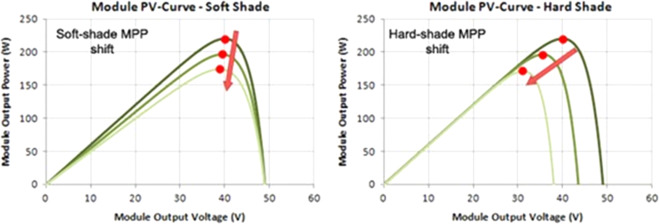
MPPTs or Maximum Point Power Trackers use complex electronics in the form of a DC to DC converter with input and output measurements to try to maximize the input loading of the tracker to cause the maximum power point of the solar panel to be achieved. It should be noted that the power point of a panel can change rapidly due to fluctuating cloud conditions, temperature, precipitation, tree shading etc. Good MPPT converters take hundreds or thousands of measurements per second in an attempt to compensate for this.
On the vast majority of panels, the Voc (Open Circuit Voltage), Isc (Short Circuit Current), Vmp and Imp (Voltage and Current at Maximum Power) are specified. The differences between panels with regard to these parameters is one reason why it is important to use the same model number of panel when building strings and arrays. Dissimilar parameters would make it difficult for the MPPT to make the adjustments necessary to track maximum power. If adding on to your array, it is important to try to match the parameters between panels as closely as possible if the same model number of panel is not available.
Peak Solar Hours
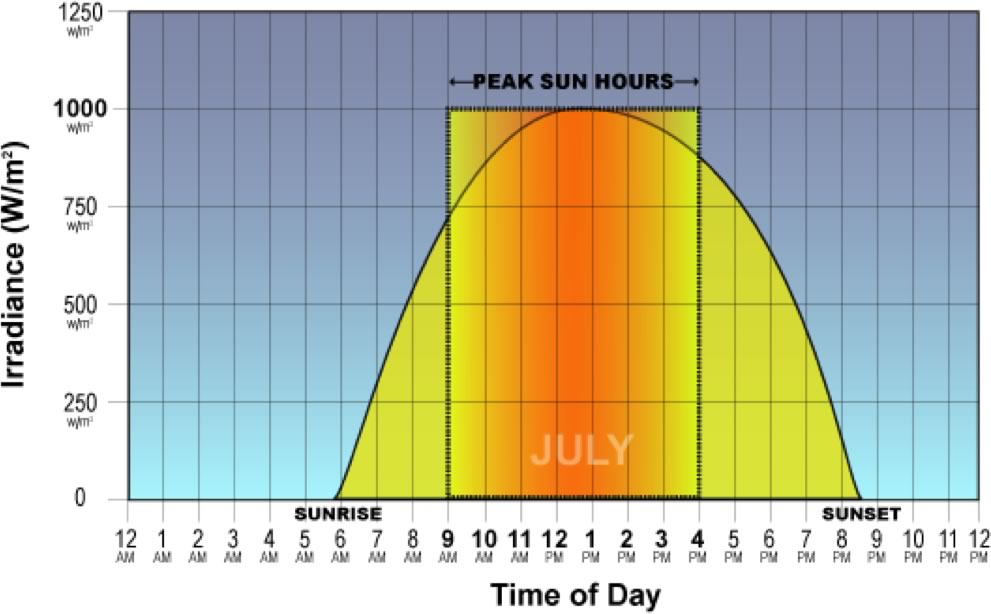
A peak sun hour is defined as one hour in which the intensity of solar irradiance (sunlight) reaches an average of 1,000 watts (W) of energy per square meter (roughly 10.5 square feet).
Another way to look at it is that a peak sun hour is the equivalent of 1000 W/m² of sunlight for an hour.
A peak sun hour represents the amount of sunlight for which most solar panels are rated at their output, that is, a 300W panel is specified to produce 300W when the amount of solar irradiation hitting the earths surface is 1000W/m^2. Solar panels are only likely to receive around that much sunlight when facing directly towards the sun when the sun is at its strongest, at midday.
Solar Hours/Day
If there are a number of peak sun hours per day, what's the terms solar hours/day used for?
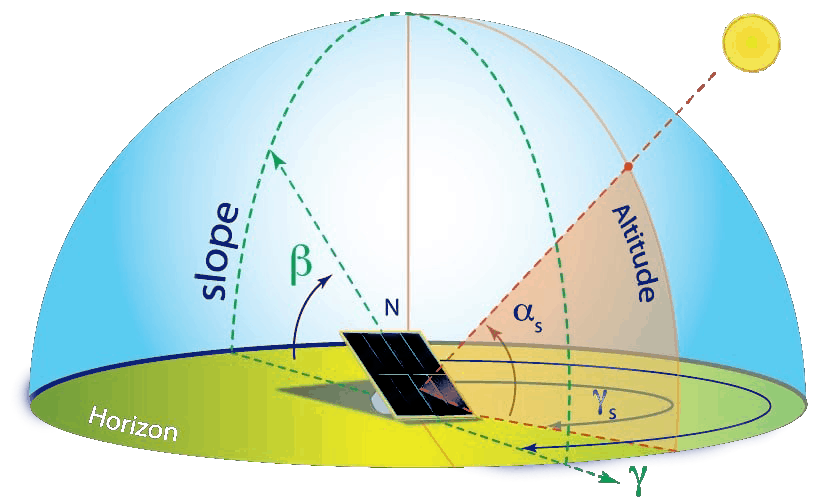
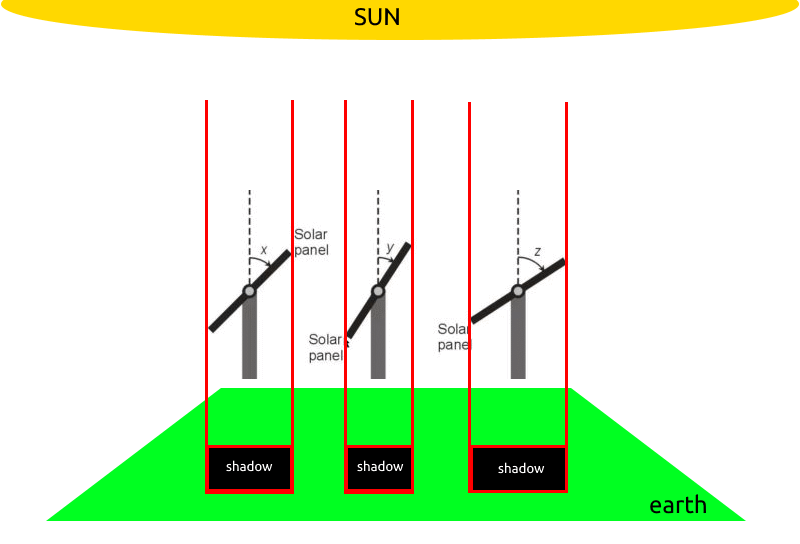
The answer is that there is at least one other factor that is a major contributor to how much power your panels can actually produce. This factor is the angle at which the sun hits the solar panel. For the nerdiest of you, the equivalent ratio is the cosine of the angles, along each edge of the panel, normal to a plane on the surface of the earth. In visual terms, it is the ratio of the size of the shadow being cast by the solar panel when a piece of cardboard is placed behind the panel and the cardboard is oriented perfectly perpendicular to the sun.
In the illustration with the solar panels at different angles, one can see the difference in the size of the shadow cast. Now imagine that the angle of the panels is fixed, but the sun moves to change the angle, along with a piece of cardboard behind the panel that is always facing the sun. The same shape of shadow will be cast. The smaller the shadow, the smaller the effective area that is being hit with sunlight, and hence a reduction in power output.
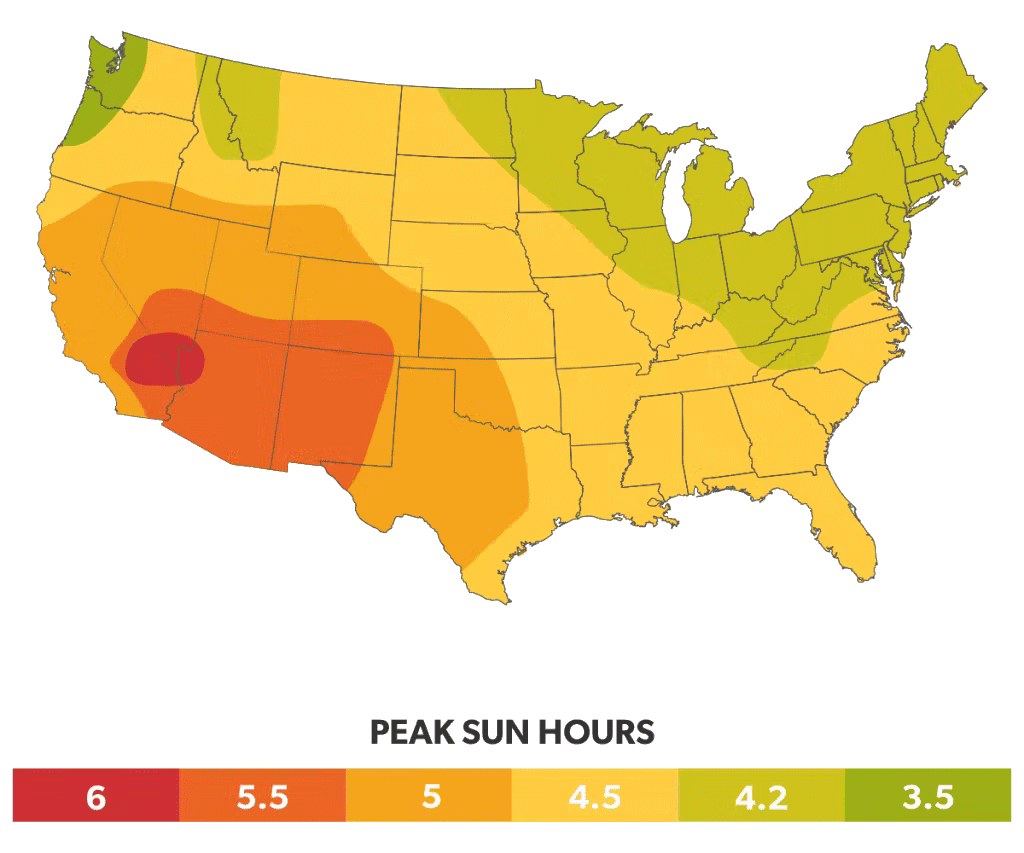
The table below gives you a rough idea of what this boils down to.
Location |
Equivalent Solar Hours/Day |
| Alabama | 3.5 – 4 |
| Alaska | 2 – 3 |
| Arizona | 7 – 8 |
| Arkansas | 3.5 – 4 |
| California | 5 - 7.5 |
| Colorado | 5 – 6.5 |
| Connecticut | 3 |
| Florida | 4 |
| Georgia | 4 – 4.5 |
| Idaho | 4 – 4.5 |
| Illinois | 3 – 4 |
| Indiana | 2.5 – 4 |
| Iowa | 4 |
| Kansas | 4 – 5.5 |
| Kentucky | 3 – 4 |
| Louisiana | 4 – 4.5 |
| Maine | 3 – 3.5 |
| Maryland | 3 – 4 |
| Massachusetts | 3 |
| Michigan | 2.5 – 3.5 |
| Minnesota | 4 |
| Mississippi | 4 – 4.5 |
| Missouri | 4 – 4.5 |
| Montana | 4 – 5 |
| Nebraska | 4.5 – 5 |
| Nevada | 6 – 7.5 |
| New Hampshire | 3 – 3.5 |
| New Jersey | 3.5 – 4 |
| New Mexico | 6 – 7 |
| New York | 3 – 3.5 |
| North Carolina | 4 – 4.5 |
| North Dakota | 4 – 4.5 |
| Ohio | 2.5 – 3.5 |
| Oklahoma | 4.5 – 5.5 |
| Oregon | 3 – 5 |
| Pennsylvania | 3 |
| Rhode Island | 3.5 |
| South Carolina | 4 – 4.5 |
| South Dakota | 4.5 – 5 |
| Tennessee | 4 |
| Texas | 4.5 – 6 |
| Utah | 6 – 7 |
| Vermont | 3 – 3.5 |
| Virginia | 3.5 – 4 |
| Washington | 2.5 – 5 |
| West Virginia | 3 |
| Wisconsin | 3.5 |
| Wyoming | 5.5 – 6 |
What are we missing?
Let us know what other topics or advanced topics you would like covered